↗
Continuation-first
Designed around bullish consolidation patterns after strong moves, not noisy day-trading chatter.
BullFlag.ai is being built to surface high-quality bullish flag, wedge flag, and pennant setups from market data — clean charts, clear risk levels, and actionable continuation ideas.
Join the BullFlag.ai list for product updates, research notes, and early access as the scanner develops.
BullFlag.ai focuses on classic bull flag structures: the standard bullish flag, the bullish wedge flag, and the bullish pennant.
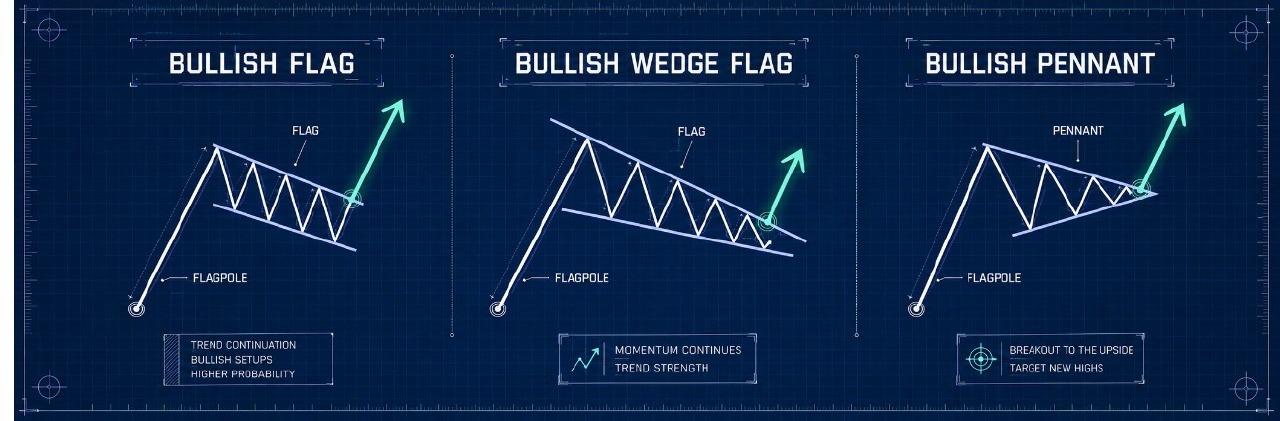
Bull flags are one of the classic continuation patterns in technical analysis. They usually appear after a sharp advance, when buyers pause and price drifts sideways or slightly lower inside a tight, orderly consolidation. The strong advance is the flagpole; the consolidation is the flag. The pattern reflects a market catching its breath rather than completely reversing. Early chartists described the structure because it showed up repeatedly in leading stocks, commodities, and indexes during powerful trends, long before modern scanners or algorithmic tools existed.
The opportunity comes from the balance between momentum and risk control. A good bull flag often forms after clear institutional demand, then contracts in volume and volatility as short-term traders take profits. If price breaks above the upper boundary of the flag with renewed volume, traders may interpret that as evidence that demand has returned and the prior trend is trying to continue. The most useful setups tend to have a strong prior move, a controlled pullback, support near key moving averages or prior breakout levels, and an entry area that allows a logical stop if the pattern fails.
Bull flags also appear in related forms, including wedge flags and pennants. Each variation shows the same basic idea: a prior impulse, a consolidation phase, and a potential breakout. The details matter. A shallow, tight flag in a leading stock often carries a different message than a loose, choppy pullback in a weak group. Market direction, sector strength, volume behavior, earnings dates, and nearby resistance all affect whether the setup is worth attention.
Bull flags are not automatic buy signals. Failed breakouts, weak markets, earnings risk, and overly extended stocks can turn attractive patterns into traps. That is why BullFlag.ai focuses on filtering and context, not just shape recognition. The goal is to surface candidates that deserve human review: names showing relative strength, constructive consolidation, identifiable breakout zones, and reasonable invalidation levels. Used well, bull flags can help traders find stocks where momentum, timing, and risk may align — especially for swing, trend, and position-trading workflows.
Designed around bullish consolidation patterns after strong moves, not noisy day-trading chatter.
Candidate setups are meant to be easy to review visually, with a focus on structure, momentum, and breakout zones.
Follow @BullFlagAI for public examples as the system matures from research into repeatable scans.